|
At its simplest, correlation involves collecting data on insect density and some measure of insect impact on the weed. This is done at several sites where insect density varies by at least an order of magnitude. The data are then tested by correlation analysis to see if there is any relationship between changes in insect density and the measure of impact. Where the relationship is significant, a regression line may be fitted so that the effect may be quantified. By applying the fundamentals of experimental design to setting up the sites, and if pre-release studies are used to predict the types of impact to look for, clear results can be obtained. However, the method is still reliant on correlation, so a causal relationship cannot be strongly claimed for any relationship observed. Alternative explanations of the observed phenomena, other than effects of the biological control agent on the weed, are possible. This does not mean that conclusions based on the method are wrong, just that there is little assurance that they are right
(Hairston 1989).
Correlation works best when permanent sites are established and trends over time can then be studied. Site selection should be approached with the same rigour as if designing an experiment. The number of sites and their geographical distribution will be determined by the characteristics of the system under study. The aim should be to get as representative a sample of weed habitats as possible and, importantly, a range of control agent densities.
The advantages of correlation are that it:
 | avoids difficulties of exclusion experiments; |
 | can be used at scales from fine to large. |
The disadvantages of correlation are that:
 | it is not rigorous - correlation does not necessarily imply causation; |
 | densities of agents at a site may vary over the period of measurement, so requiring decisions about what density should be used in the analysis. |
Correlation was used to determine the impact of the tip-boring moth Neurostrota gunniella on the weed
Mimosa pigra in the north of Australia. Fifteen sites were established on the lower Adelaide River flood plain in the Northern Territory. Sites were a minimum of 500 m apart and clusters of sites were up to several
kilometres apart. At each site 20 litter trays were erected to measure the seed output of mimosa. The number and design of these trays had been determined by previous work
(Lonsdale 1988 and unpublished data, see
Farrell et
al. 1992 for tray design). Trays were placed out in November, before seeding, and collected around the end of seeding in July. At each site insect density was measured by randomly collecting 100 branch tips, 50 cm long, from trees over and near the litter trays. A preliminary sampling program had established that the later instar larvae of
N. gunniella do the majority of the damage to the plant, and these larvae occur in the upper
20-50 cm of the branches. Branch samples were returned to the laboratory where they were dissected and the number of larvae counted. Larval density per site was then plotted against seed density.
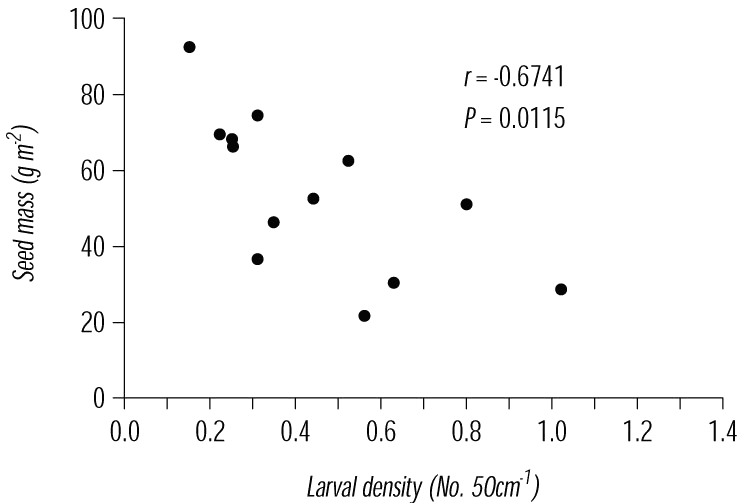
The Figure below shows the data for the first year of the program. Analysis of the data showed a negative correlation between larval density and seed density. At the highest densities,
N. gunniella apparently suppressed seed production by up to 60%. This was not in itself sufficient to impact on the demographics of the weed, however, and no changes in plant density occurred.
Use of correlation to measure impact of a control
agent.
Relationship between larval density of Neurostrota gunniella
and seed output of Mimosa pigra on the Adelaide River, northern
Australia in the 1990/91 wet season.

[ Back ] [ Next ]
Grant Farrell and
Mark Lonsdale
|
|

